Waste Stops Flow
Imagine you have a pipe and it can deliver a litre of water a minute to a tank. Now, imagine if that pipe gets hole in it and then gets blocked up, perhaps a kink or two. All of this means that you are no longer getting a litre of minute to your tank and you now have to find the leaks, take time and effort to unblock and unkink the pipe and perhaps even carry the water by hand from source to the tank.
This is the effect waste has on your ability to deliver. It takes away capacity and makes it more expensive and more time consuming to things. All of that is effort you could be using to deliver value to your customer. Yet not may visualisations or chanson boards even show this wasted effort. If you can’t see it, you won’t do anything about it.
How much time does a story sit waiting on other people, or going back for clarification ?
How much time of your time is spent on defects (which is wasted effort) ?
Where exactly is your capacity being spent ?
#WarOnWaste
CHALLENGE YOURSELVES
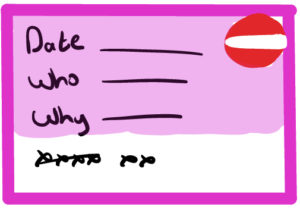
Spend 15 minutes at your next stand up taking a pink sticky and placing it on all work that is waiting or stuck. You can also create a card with a NO ENTRY sign on it, or anything that grabs the eye. The trick is to get an idea of where your work isn’t flowing in 21 seconds.
 Make space on the card to have the following information:
– The date it stopped flowing
– Why it is stuck
– Who is resolving it
– Space to mark with an x the number of days it has been stuck (like prisoners do on their walls).
When it gets unstuck move the blocker card to its own section so you can start to gather information on how much of your time is spend with waste and where that time is going. This information then allows you to start to create counter measures to take the waste out of the system.


